July 11, 2026 · 11 min read · methodology
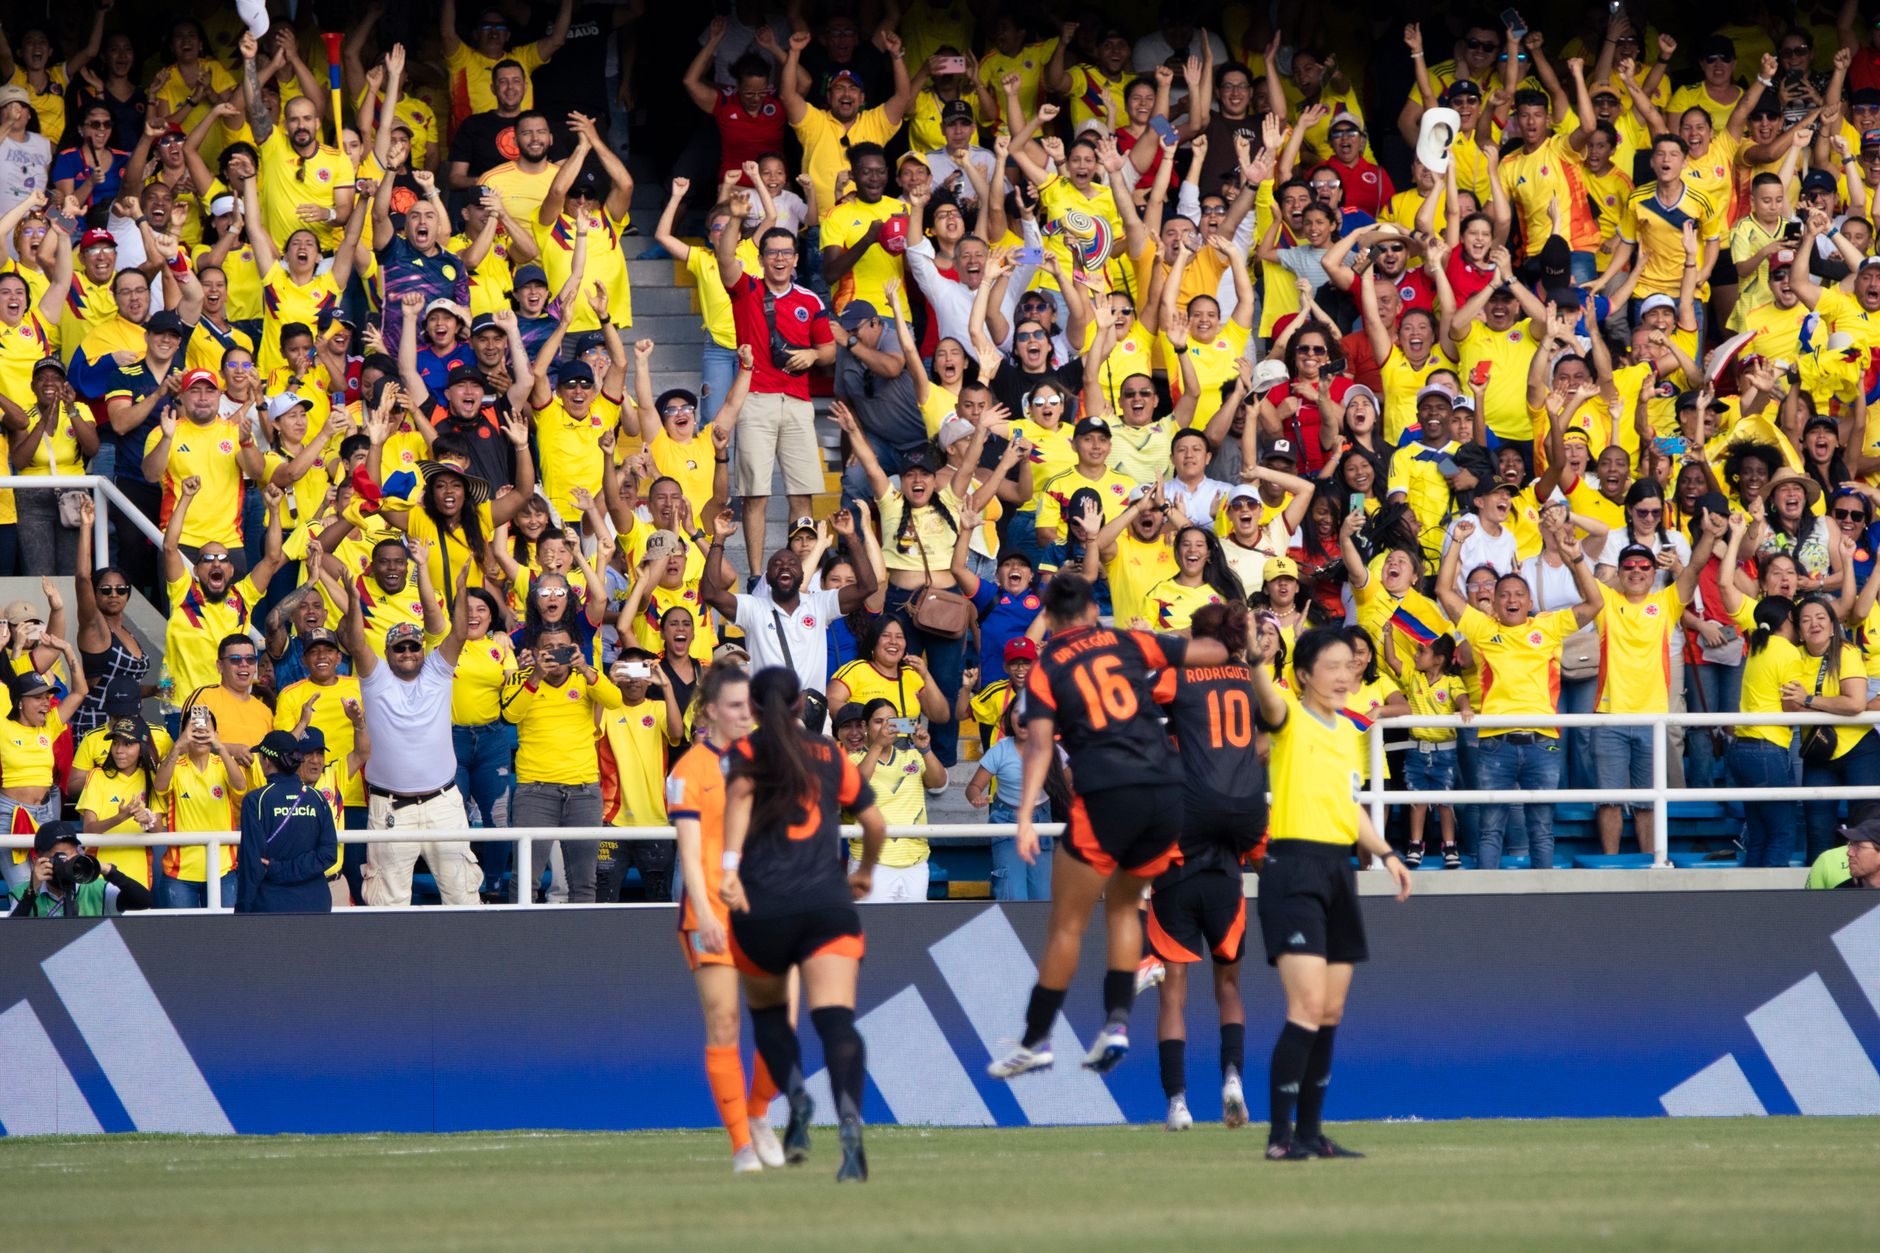
Match State Analysis — How the Scoreline Changes Team Behavior and What It Means for Your Predictions
July 11, 2026 · 12 min read
Most prediction models treat a football match as a single event with one set of expected outcomes. But the moment the first goal hits the net, everything changes — pressing intensity, passing patterns, defensive shape, and even the referee's behavior. Match state analysis is the missing layer in most prediction frameworks, and understanding it can give you a decisive edge.
What Is Match State?
Match state — sometimes called game state — describes the current scoreline situation from a team's perspective. It answers a simple but powerful question: is this team winning, losing, or drawing right now?
The concept is straightforward, but its impact on match dynamics is anything but. When a team takes the lead in the 23rd minute, the remaining 67 minutes of football are fundamentally different from a match that stays level until the 90th. The leading team's manager makes different substitution decisions. The trailing team's pressing triggers change. Even the xG profile of the match shifts — not because the teams are different, but because the scoreline forces behavioral changes that raw pre-match models cannot capture.
This is why two matches between the same teams can produce wildly different shot profiles, possession splits, and tactical patterns — the match state drives the football, not the other way around.
The Three States: Leading, Trailing, and Level
Each match state produces a distinct behavioral fingerprint. Understanding these patterns is the foundation of match state analysis.
When a Team Leads
Teams that take the lead undergo a measurable tactical shift. Across the top five European leagues and major international tournaments, research from StatsBomb and Opta has documented consistent patterns:
- Pressing intensity drops 15-20%. The leading team's PPDA (Passes Per Defensive Action) increases, meaning they allow the opponent more passes before engaging. They sit deeper and conserve energy.
- Possession share decreases. The leading team cedes the ball, often deliberately. They don't need to attack — they need to defend.
- Shot volume drops, but shot quality may improve. Leading teams take fewer shots overall but often create higher-quality chances on the counter-attack as the trailing team pushes forward and leaves gaps.
- Passing becomes more conservative. Fewer forward passes, more sideways and backward circulation. The goal is to run down the clock, not create chances.
These shifts are not random — they are rational responses to the incentive structure of the scoreline. A team leading 1-0 gets the same three points whether they win 1-0 or 3-0. The marginal value of a second goal is far lower than the cost of conceding an equalizer.
When a Team Trails
The mirror image: trailing teams become more aggressive, more direct, and more vulnerable.
- Pressing intensity increases 25-40%. Trailing teams press higher and more frequently, trying to win the ball back in dangerous areas.
- Shot volume rises significantly. More shots from distance, more crosses into the box, more set-piece routines. The quantity increases, but the average quality often drops as desperation leads to low-percentage attempts.
- Defensive shape breaks down. As the trailing team commits more players forward, gaps appear between the lines. Counter-attacks against a trailing team are among the highest-xG sequences in football.
- Substitution patterns shift dramatically. Managers bring on attacking players earlier, sometimes at half-time. Defensive midfielders are replaced by wingers or second strikers.
At the World Cup 2026 knockout stage, this pattern has been visible in nearly every match. Trailing teams in the Round of 16 generated an average of 2.3 more shots per match after conceding than before — but conceded 1.8 more counter-attack chances in the process.
When the Score Is Level
The level state is the baseline — but it is not neutral. Home teams in level scorelines tend to be slightly more attacking (by about 5-8% in xG generation), while away teams sit deeper and wait for opportunities. The longer a match stays level, the more cautious both teams become — particularly in knockout football where a draw leads to extra time.
A critical insight: the timing of the first goal matters enormously. A goal in the 10th minute creates 80+ minutes of asymmetric match states. A goal in the 80th minute creates only 10+ minutes. The same 1-0 scoreline produces radically different tactical landscapes depending on when it arrives.
The Data: How Match State Affects Key Metrics
To make match state analysis concrete, here is how key performance metrics shift across the three states, based on aggregated data from the 2022-2025 Premier League and Champions League seasons:
| Metric | Leading | Level | Trailing |
|---|---|---|---|
| Shots per 90 min | 10.2 | 12.8 | 15.6 |
| xG per shot | 0.11 | 0.10 | 0.08 |
| PPDA (pressing intensity) | 14.2 | 11.5 | 8.7 |
| Counter-attacks faced | 3.8 | 2.4 | 1.6 |
| Win probability (from this state) | 72% | 45% | 15% |
Notice the inverse relationship: trailing teams take 53% more shots than leading teams, but their xG per shot is 27% lower. The raw shot count is misleading — it suggests dominance, but the quality tells a different story. This is one of the most common traps in football analysis.
Why Most Prediction Models Get This Wrong
Standard pre-match prediction models — whether they use xG, Elo ratings, or Poisson distributions — generate a static probability for the match outcome. They calculate the chance of Team A winning before kick-off, but they don't update that probability as the match unfolds and the scoreline changes.
This creates three specific problems:
- Overweighting pre-match form. A team on a five-match winning streak looks strong in the model, but if they concede first and shift to a trailing state, their "form" becomes largely irrelevant. The match state overwhelms the form signal.
- Ignoring tactical adaptation. Pre-match models assume both teams play their "average" style for 90 minutes. In reality, the style changes with every goal. A model that doesn't account for this will systematically overestimate the probability of comebacks (because it doesn't adjust for the leading team's defensive shift) and underestimate the chance of late goals from the leading team's counter-attacks.
- Misreading xG accumulation. If Team A has 2.5 xG and Team B has 0.8 xG in a match, a naive reading suggests Team A dominated. But if Team A's xG was accumulated primarily while trailing (lower-quality shots from desperation), and Team B's was accumulated while leading (clinical counter-attacks), the actual match dynamics were the opposite of what the final xG totals suggest.
Building Match State Into Your Prediction Framework
Integrating match state analysis into your predictions doesn't require rebuilding your model from scratch. Here are four practical approaches, from simple to advanced:
Approach 1: The State-Adjusted xG Modifier
The simplest approach: when evaluating a team's recent xG data, separate it by match state. If a team averaged 1.8 xG per match over their last five games, but 1.2 of that came while trailing (lower quality), their "true" attacking strength is lower than the raw number suggests. Apply a modifier: reduce their xG by 10-15% if most of their chances came in a trailing state, and increase it by 5-10% if they generate chances while leading (counter-attack quality).
Approach 2: First-Goal Probability Modeling
Instead of predicting the final score directly, model the probability of each team scoring first — then apply match state adjustments to project the final outcome. Teams that score first win approximately 69% of matches across top leagues. If you can accurately predict who scores first, you already have a strong baseline for the match result.
To predict the first goal, look at: early-match pressing intensity (teams that press high in the first 15 minutes score first more often), set-piece efficiency (corners and free kicks account for ~30% of opening goals), and historical head-to-head first-goal patterns.
Approach 3: Live-Match State Trees
For live prediction (which FanPick's real-time scoring rewards), build a decision tree that maps all possible match states at each time point. At the 60th minute of a 0-0 match, the possible outcomes branch into: home scores first (leading state), away scores first (trailing state), or stays level. Each branch has different probabilities for the final outcome. By calculating the expected value of each branch, you can make more informed live predictions.
Approach 4: Bayesian Match State Transitions
The most sophisticated approach uses Bayesian updating (covered in our Bayesian Updating guide) combined with match state transition matrices. At each time step (say, every 5 minutes), you update your prediction based on the current scoreline, the time remaining, and the known behavioral shifts for each match state. This approach requires more data and computation, but it produces the most accurate in-match probability estimates.
Match State in World Cup Knockout Football
The World Cup 2026 knockout stage has provided a masterclass in match state dynamics. Knockout football amplifies the effects because the stakes are higher and the behavioral shifts more extreme.
In the Round of 16, five of the eight matches saw the decisive goal scored after the 70th minute. This is not a coincidence — it is match state dynamics in action. As the match progresses and the scoreline remains level, both teams become increasingly cautious. The risk of conceding outweighs the reward of scoring. But once one team breaks through, the trailing team's desperation creates openings that did not exist for the first 70 minutes.
The quarter-finals have continued this pattern. France's path to the semi-final was shaped by match state: once they took the lead, their defensive organization — already among the tournament's best — became even more difficult to break down. Spain's possession-based style, meanwhile, is specifically designed to control match state — by keeping the ball, they reduce the time the opponent spends in a leading state.
Common Mistakes in Match State Analysis
Avoid these pitfalls when applying match state thinking to your predictions:
- Assuming all teams respond the same way. Some teams (like Atlético Madrid under Simeone) are specifically built to defend a lead. Others (like Klopp's Liverpool) maintain their pressing intensity regardless of scoreline. Always adjust for the team's tactical identity, not just the generic match state pattern.
- Ignoring the five-substitution rule. Since the permanent adoption of five substitutions, trailing teams have more tactical flexibility to change their approach. A manager can bring on three fresh attackers at 60 minutes without sacrificing defensive cover entirely. This has increased the comeback rate in matches where the trailing team makes early substitutions.
- Overweighting early goals. A goal in the 5th minute creates a long trailing state, but the trailing team has 85+ minutes to respond. Early goals are less decisive than late goals — the match state time remaining ratio matters. A 1-0 lead in the 80th minute is far more valuable than a 1-0 lead in the 10th minute.
- Confusing correlation with causation. A team that concedes more shots while leading may not be "defending deep by choice" — they may simply be a weaker team that happened to score first. Always check whether the match state behavior is a tactical choice or a quality gap.
Key Takeaways
- Match state is the single biggest in-match factor that changes team behavior. No pre-match model can fully capture its effects — you need to account for it separately.
- Leading teams take fewer but higher-quality shots; trailing teams take more but lower-quality shots. Raw xG and shot counts are misleading without match state context.
- Teams that score first win ~69% of matches. Predicting who scores first is a powerful shortcut to predicting the match result.
- The timing of goals matters as much as the goals themselves. Late goals produce extreme match state effects with little time to recover, which is why knockout football produces so many late drama moments.
- Apply match state modifiers to your xG analysis. Separate a team's attacking output by whether they were leading, trailing, or level — the context tells you far more than the raw numbers.
Match state analysis is not a separate prediction model — it is a lens that makes every model more accurate. By understanding how the scoreline shapes the football, you can read matches in real time, adjust your predictions as the game unfolds, and avoid the traps that catch even experienced analysts. The scoreline is not just the result — it is the cause of everything that follows.